PetroPlot Tutorial
Directories and files
Upzip PetroPlot.zip on your hard drive:
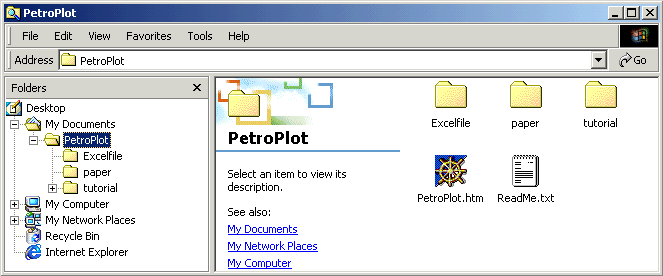
A new folder called "PetroPlot" will appear.
The following example puts the "PetroPlot" folder under "My Documents" on a PC.
You can put it in any convenient location.
This directory contains two files: ReadMe.txt , PetroPlot.htm .
and three sub-folders: Excelfile , paper , tutorial
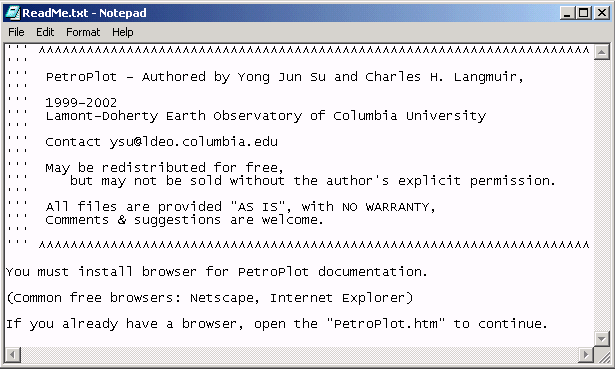
1. ReadMe.txt -- Start up info.
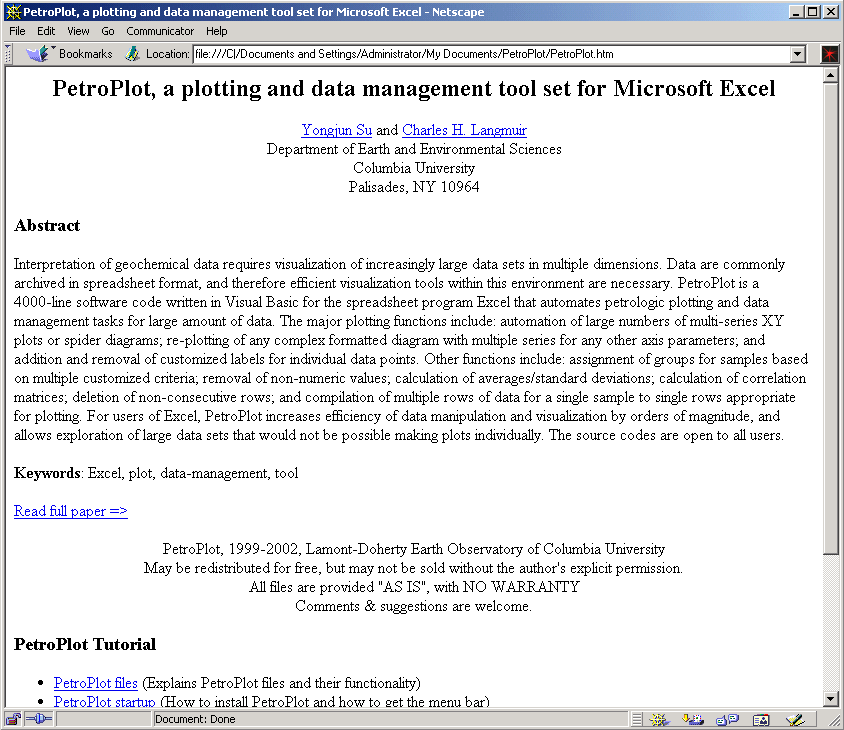
2. PetroPlot.htm -- The home page for documentation.
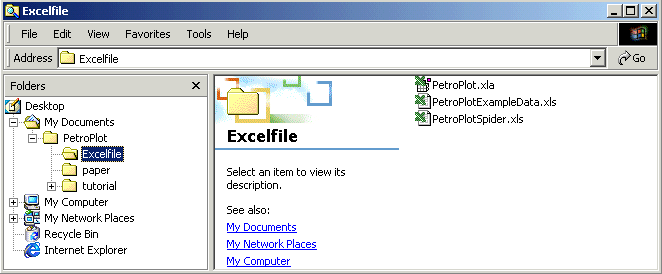
3. The folder Excelfile contains three files:
PetroPlot.xla,
PetroPlotSpider.xls,
PetroPlotExampleData.xls.
PetroPlot.xla
As the core Excel add-in library file, "PetroPlot.xla" is required for all PetroPlot functions.
Similar to other Excel add-in libraries, this file runs in the background in Excel.
The source codes can be viewed in Visual Basic Editor. (How?)
PetroPlotSpider.xls (Note: the name of this file should not be modified.)
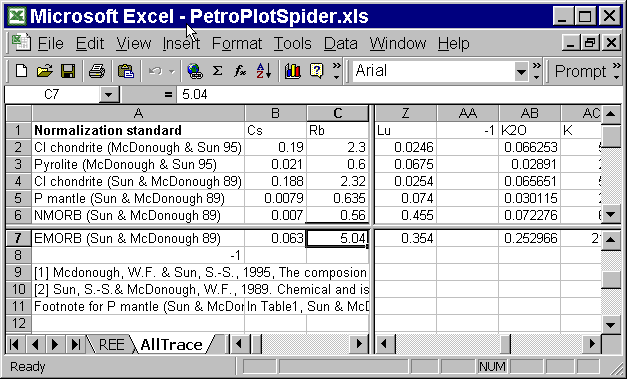
This file contains normalization standard values for spider diagrams.
Required for the PetroPlot Spider Diagram function.
It is provided with three worksheets: REE, AllTrace and MyValues.
The REE and AllTrace worksheets contain chondrite, primitive mantle
and average MORB values from Sun & McDonough (1989) and McDonough & Sun (1995);
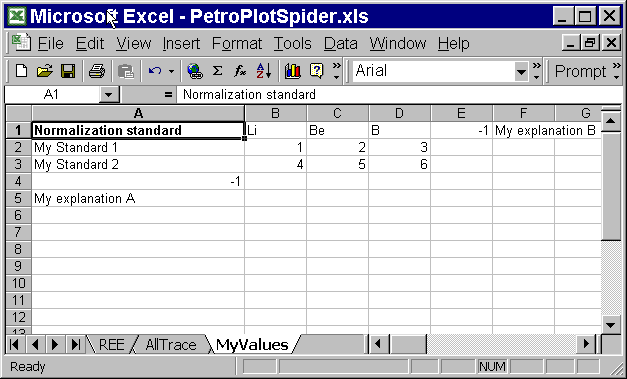
the MyValues worksheet is a demo showing how a customized worksheet
could be added to the PetroPlotSpider.xls file.
All worksheets in PetroPlotSpider.xls must obey 3 rules :
(1) Each row represents a normalization standard; each column contains values for one element.
(2) Standard names must be in Column A, and element names must be in Row 1.
(3) “-1” is required as termination value in both Column A and Row 1.
Extra information beyond the “-1” signs will not be used for spider diagram plotting.
Users may add an arbitrary number of worksheets. Inside each worksheet
(including the provided AllTrace and REE), arbitrary numbers of standards or elements can also be added.
The order of elements can be changed, and the data values can be modified.
In another words, the spider diagram normalization values are fully customizable.
PetroPlotExampleData.xls
An Excel file with petrology data for the demonstration purpose ONLY.
Data source is Niu and Batiza (1997).
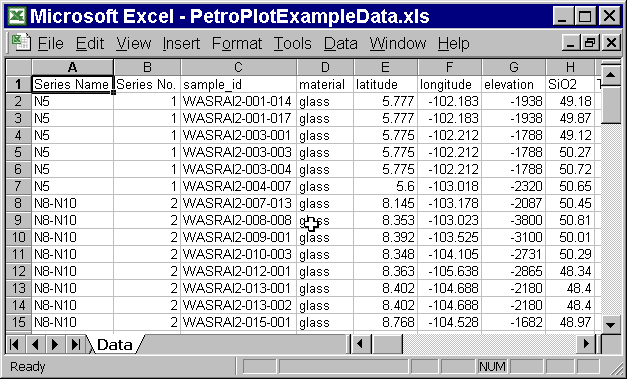
The format of an ordinary file should follow the format of this example file.
For instance, in a data sheet, each row represents a sample/analysis;
each column represents a category (location, element, element ratio, etc)
and the first row is always reserved for headers (i.e. element names etc).
However, unlike the PetroPlotSpider.xls, it is not required to put sample names in Column A.
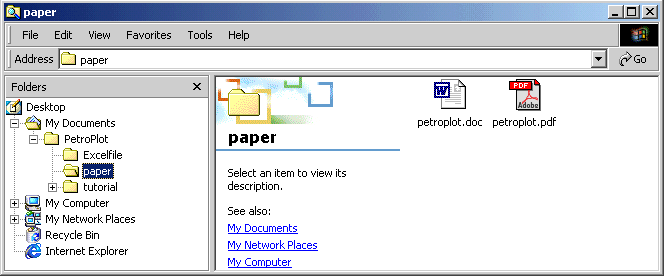
4. The folder paper .
The PetroPlot is submitted for publication
to Geochem. Geophys. Geosyst.
Official version of the paper is in this folder.
5. The folder tutorial.
Contains all tutorial documentation.
Go back to PetroPlot.htm to read the list of topics.
Last modified 05/17/2002, Yong Jun Su
This line marks the end of PetroPlot Tutorial: Directories and files


