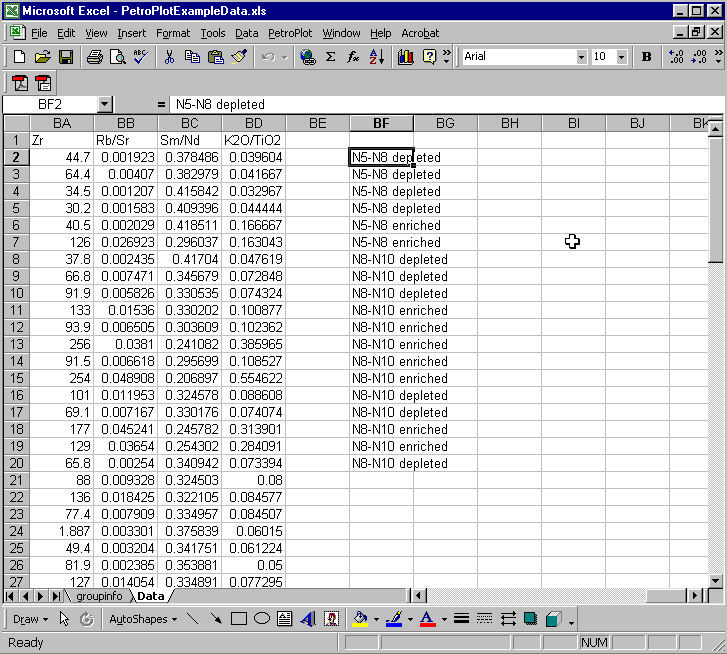
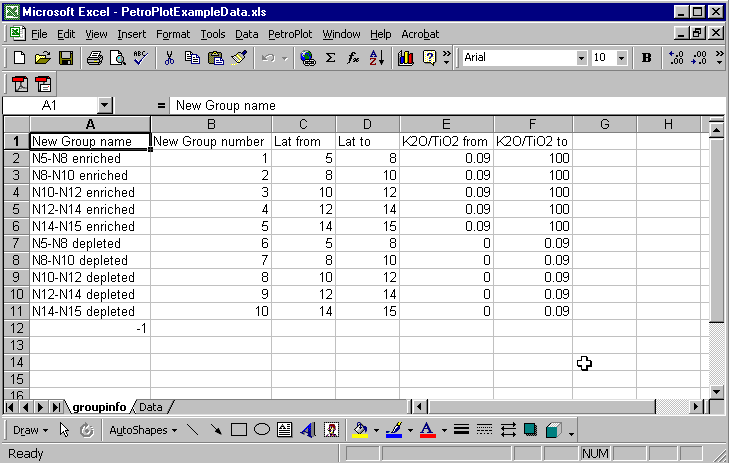
The "groupinfo" worksheet should have 6 columns and 11 rows, with a "-1" at cell A12.
Purpose:
In petrological studies, samples are often grouped by a variety of criteria,
such as locations, materials, chemical values, calculated indexes (e.g. Na8, La/Sm),
analytical methods etc.
The PetroPlot Grouping function reads grouping information from a grouping worksheet,
and assigns grouping number/ID to individual samples in the data sheet
Start: Open PetroPlotExampleData.xls in Excel.
The "groupinfo" worksheet should have 6 columns and 11 rows, with a "-1" at cell A12.

Step 1:
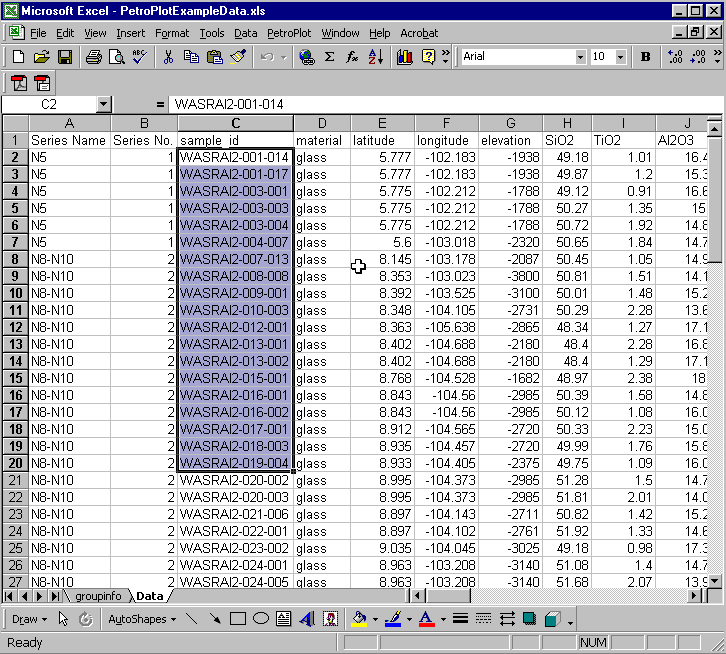
Select rows you want to work on.
Note: you can highlight any column.
Step 2: click the "PetroPlot" menubar.
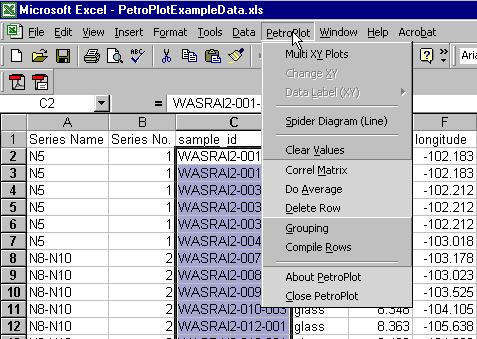
Then select the "Grouping" button.
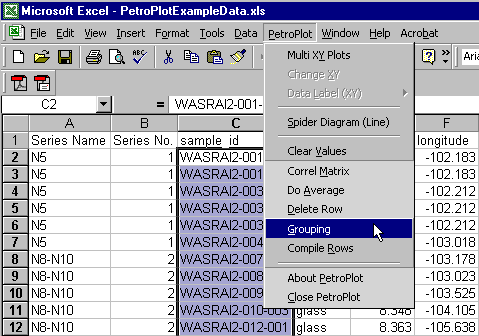
Now you see the "Grouping" window. In this window, the program reads from the "data" sheet
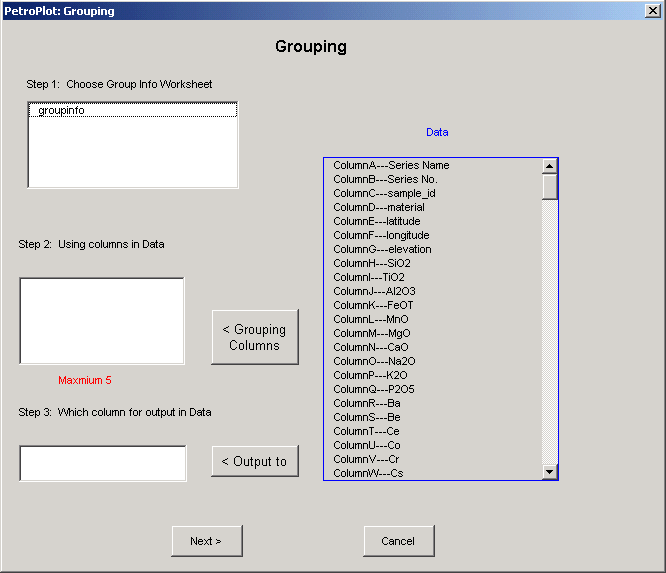
Step 3: Set up the group info sheet.
Note: you can make multiple group info sheets, and name as whatever you want.
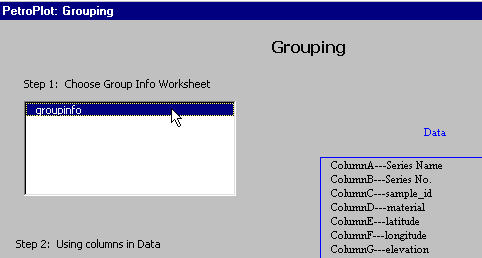
Step 4: Set up the grouping columns.
Note: Maximum number of grouping columns is 5.
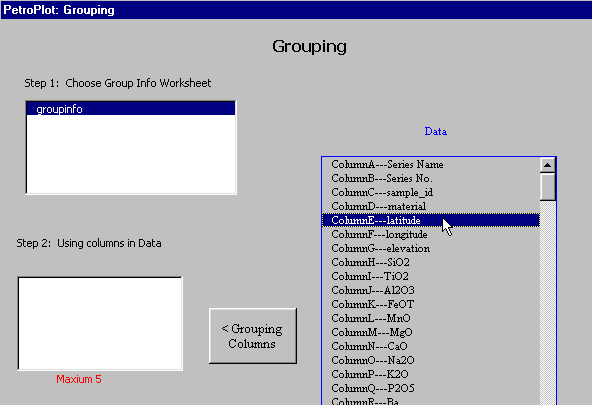
Highlight the column (image above), click the "Grouping Columns" button (image below)
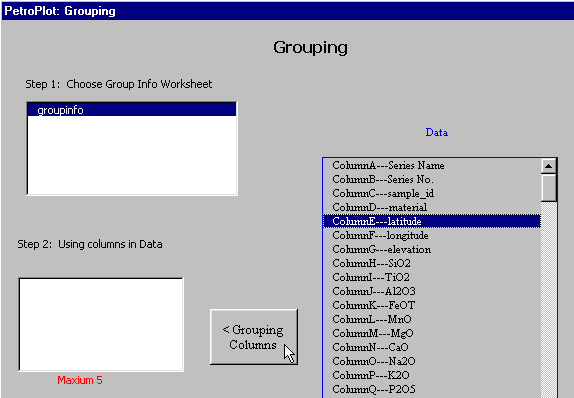
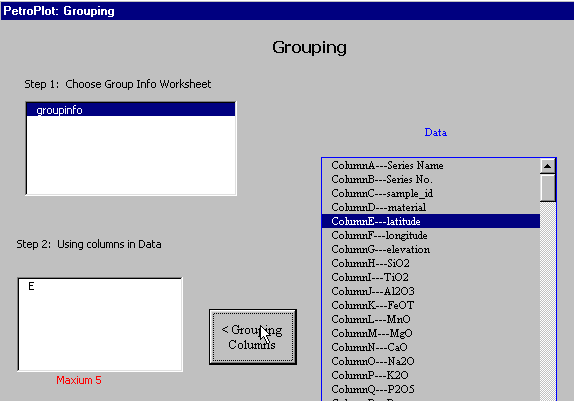
Now Column "E" is added
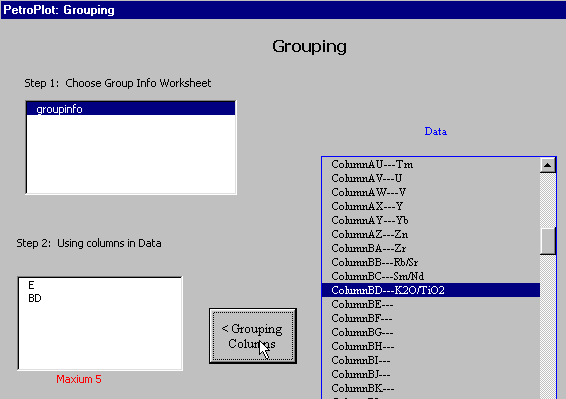
Repeat to choose all Grouping columns.
Step 5: Set up the output column.
Could be any blank column.
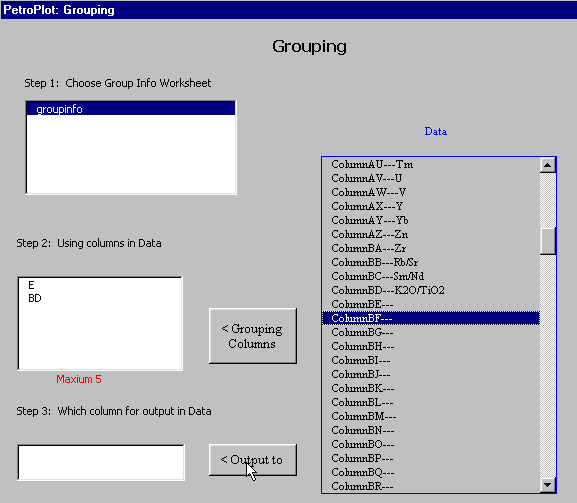
Highlight the column (image above), click the "Output to" button (image below)
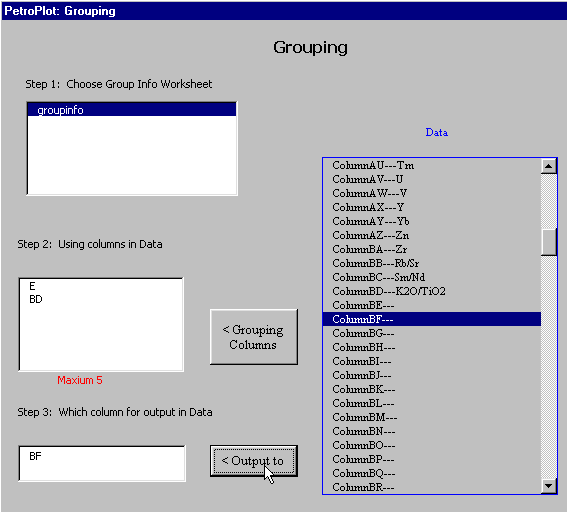
Step 6: Click the "Next>" button.
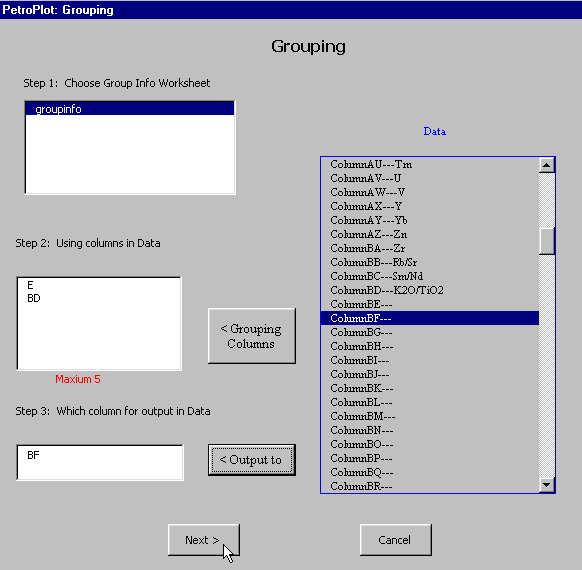
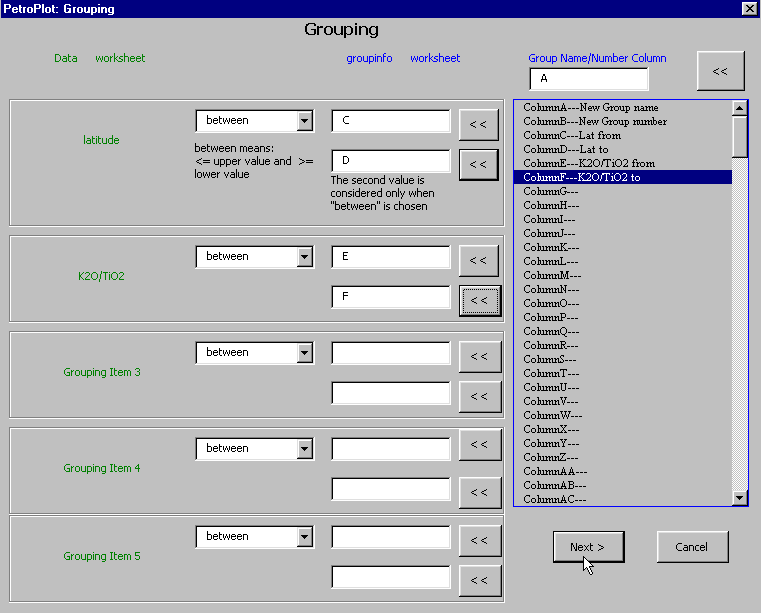
Now you see the "Grouping Next" window. In the new window, the program reads from the "groupinfo" sheet.
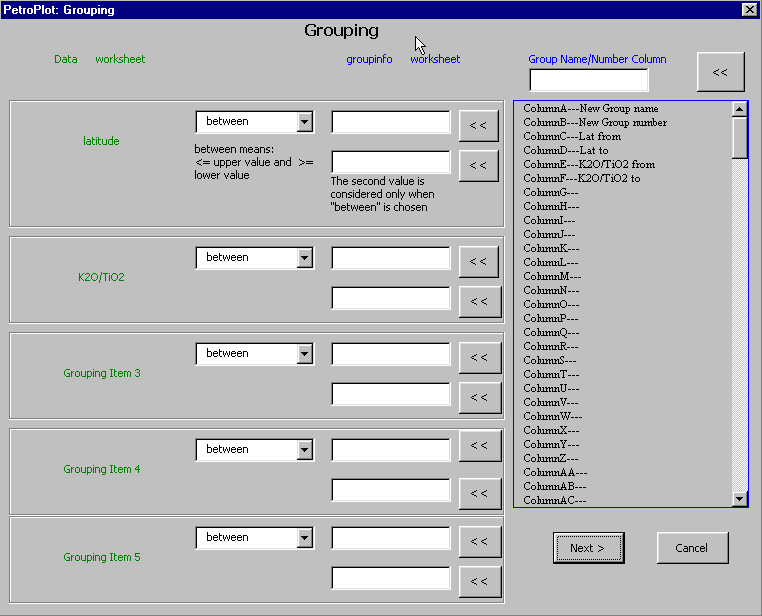
Step 7: Tell the program which column in "groupinfo" sheet contains group names.

Highlight the column (image above), click the "<<" button in the upper right corner (image below)

Step 8: Choose columns in "groupinfo" sheet
to constrain your first grouping column in "data" sheet
(in this example, the latitute column in "data" sheet").

Highlight the column, click the "<<" button next to the input box (image above)
Repeat if the criteria is "between"(image below)

Step 9: Choose columns in "groupinfo" sheet
to constrain your second grouping column in "data" sheet
(in this example, the K2O/TiO2 column in "data" sheet").
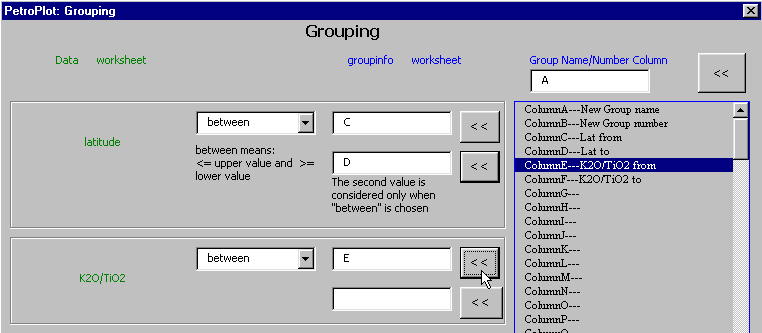
Highlight the column, click the "<<" button next to the input box (image above)
Repeat if the criteria is "between"(image below)
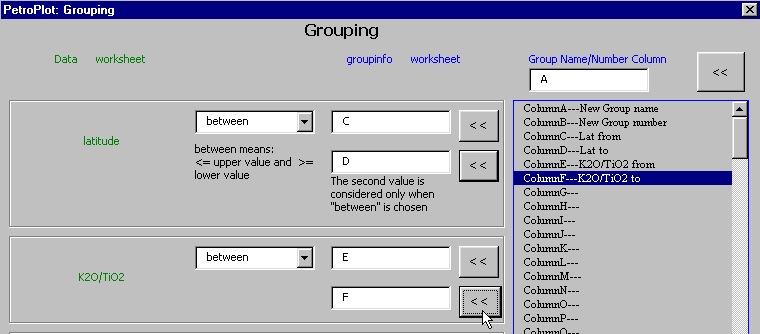
Step 10: Click the "Next>" button.
