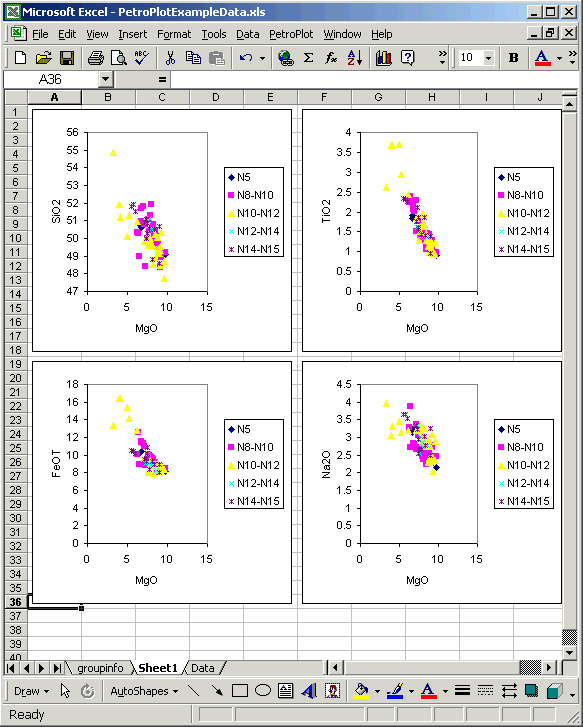
The PetroPlot multi-plot function makes a large number of XY plots at one time.
Each plot allows multiple groups of samples to be plotted using discrete symbols.
Here is an example output of this function.
Purpose:
The PetroPlot multi-plot function makes a large number of XY plots at one time.
Each plot allows multiple groups of samples to be plotted using discrete symbols.
Here is an example output of this function.

Start:
Open "PetroPlotExampleData.xls" in Excel.
Activate the "data" sheet.
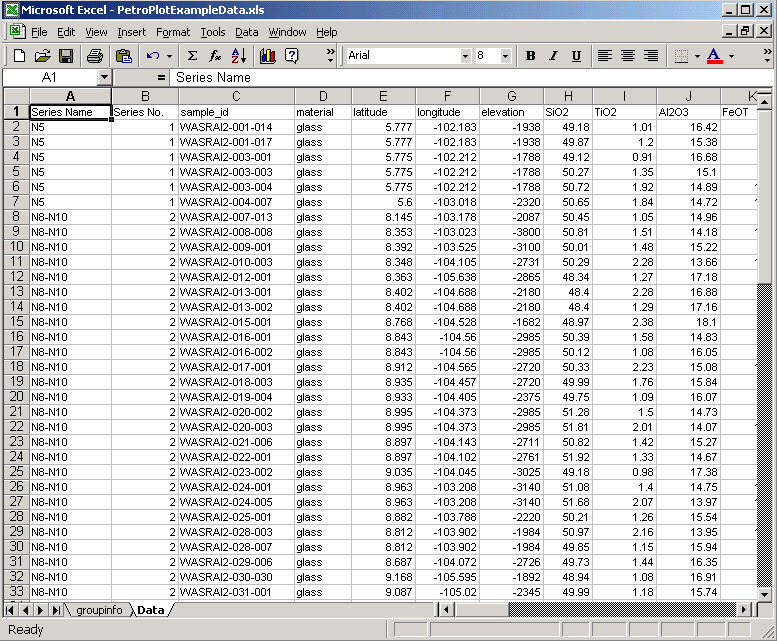
Notice: the first row of data sheet is reserved for headers (i.e. element names etc). This is mendatory to use PetroPlot.
In this example, the Column A is reserved for series name, and column B is reserved for series number.
This setup is optional. PetroPlot does not require the column positions. However, we suggest that you use the first two columns for series name & number.
Step 1:
Select the data range on "data" sheet.
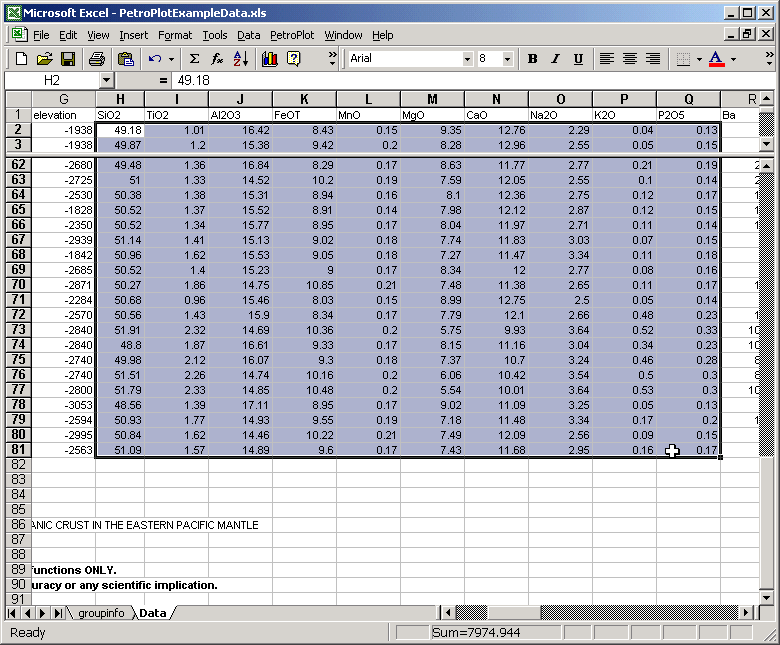
You don't need to select the series name & series number columns if they are the first two columns on the sheet
Step 2:
Click the "Multi-XY plots" button
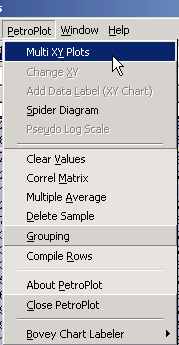
The Select Data window appears.
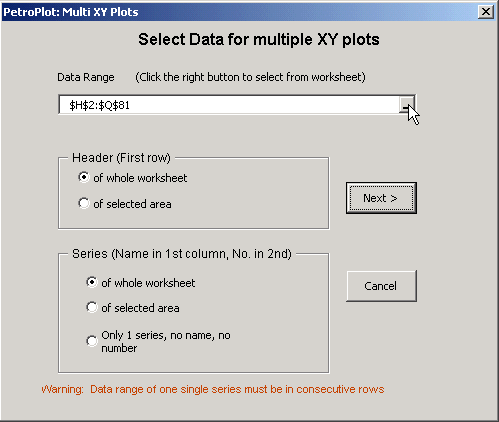
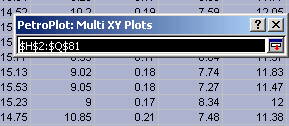
You can modify the data range by clicking the right side of the input box.
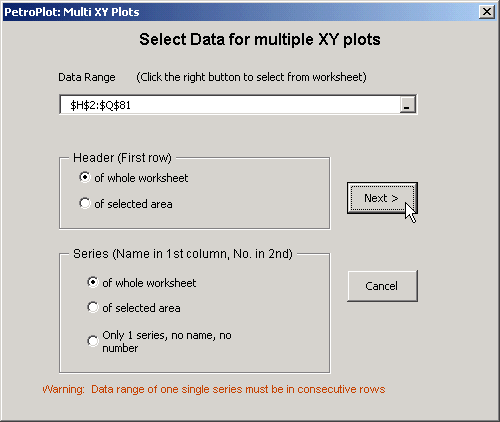
Set the Header position and series info position, then click the "Next" button.
Step 3:
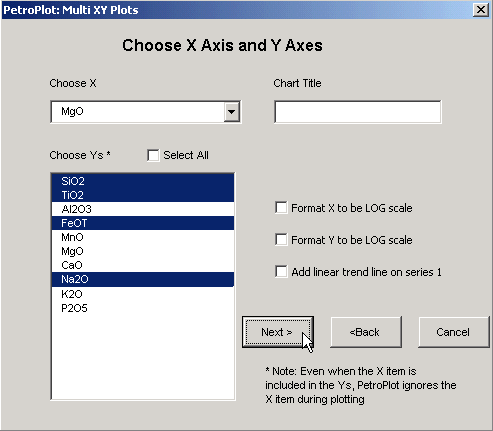
Choose axes.
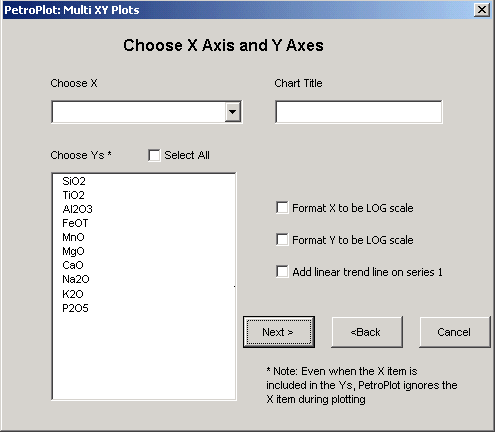
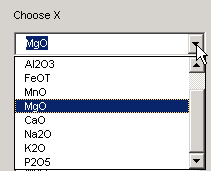
You can select ONLY ONE X-axis.
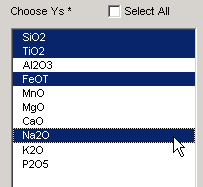
Hold the Ctrl key to select multiple Y-axes.
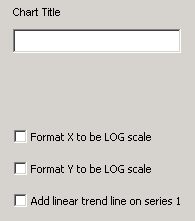
All the right side inputs are optional.
Now click the "Next" button.
