PetroPlot Known Problems
Empty cells when using "Multi-XY Plots"
Problem:
If there exist empty cells in the selected data range, the PetroPlot program might hang up.
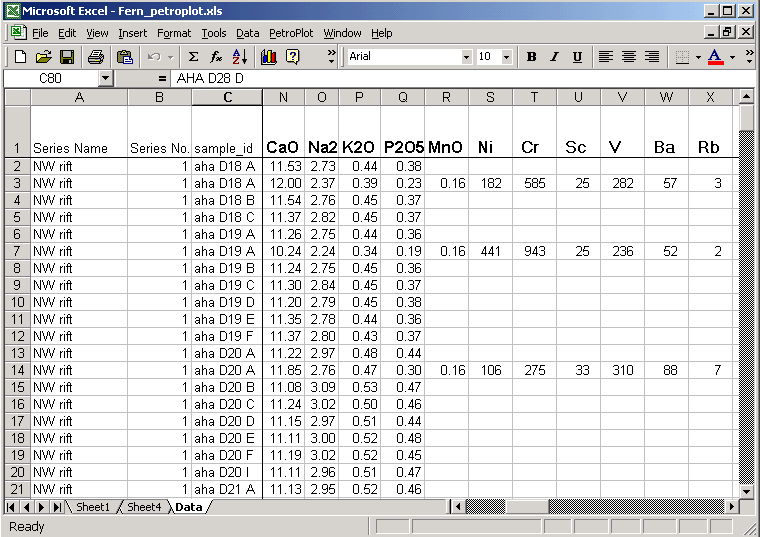
In the following example, trace element data are not complete.
Now we select a data range and run the PetroPlot "Multi-XY Plot" function
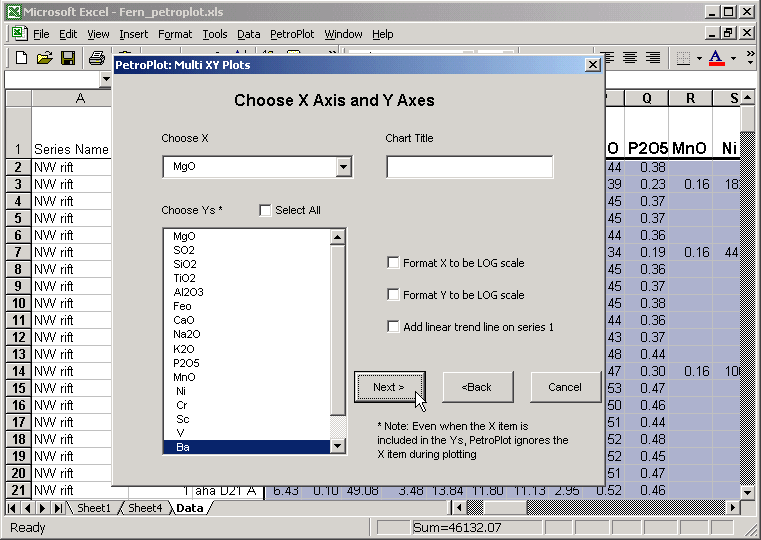
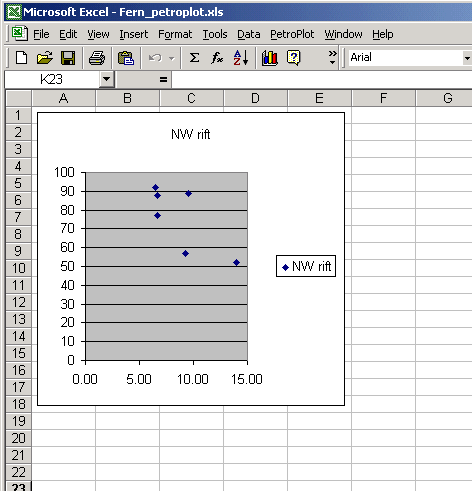
PetroPlot hangs up, gives only one series even we selected all data.
Solution:
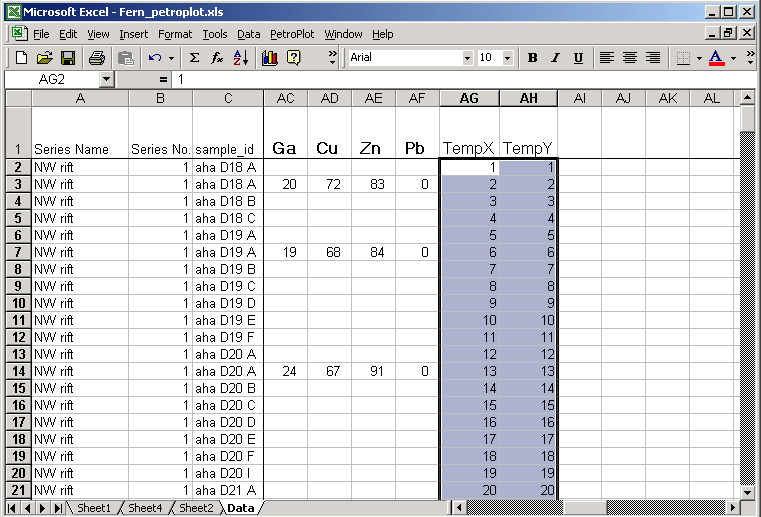
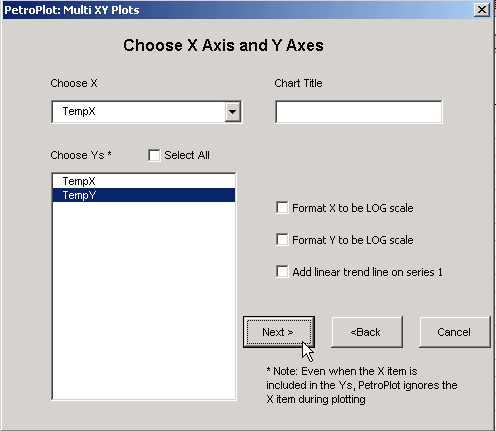
Create two columns with sequential data.
Run the PetroPlot "Multi-XY Plot" function
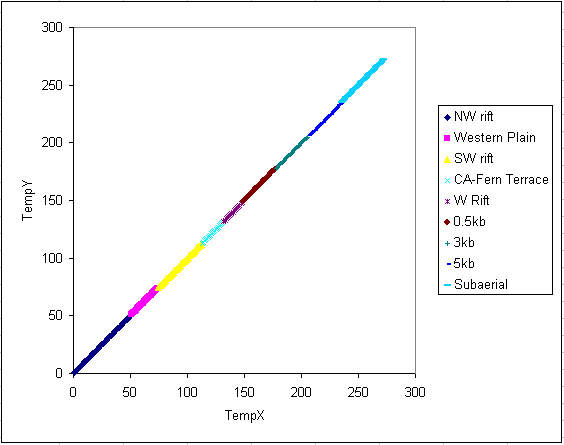
Format the TempX vs TempY chart
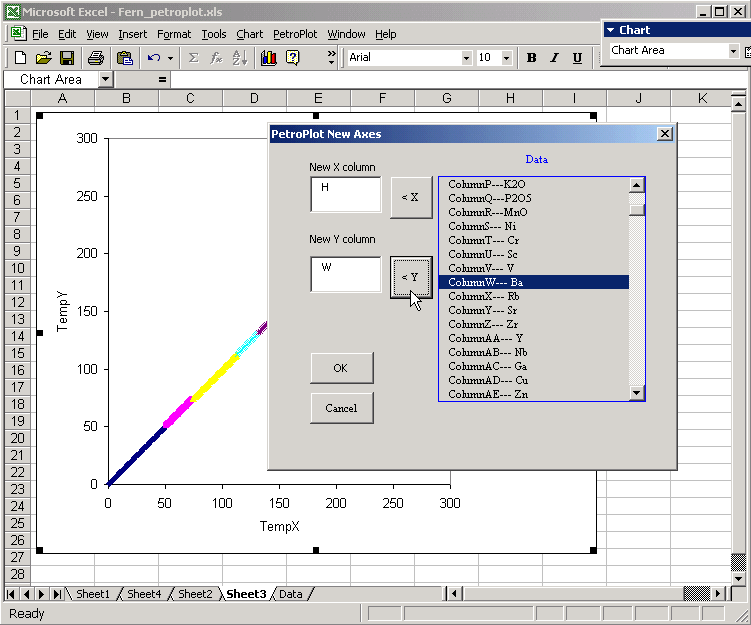
Copy the TempX vs TempY chart to another place, and run "Change XY" function
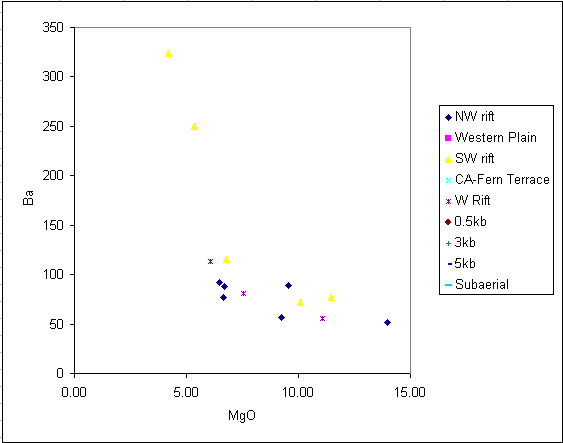
The result.
Last modified 05/10/2002, Yong Jun Su
This line marks the end of PetroPlot known problems: Empty cells when using "Multi-XY Plots"