Select a set of rows on a data sheet.
(Notice: You can select any column. PetroPlot only reads the row positions from your selection.)
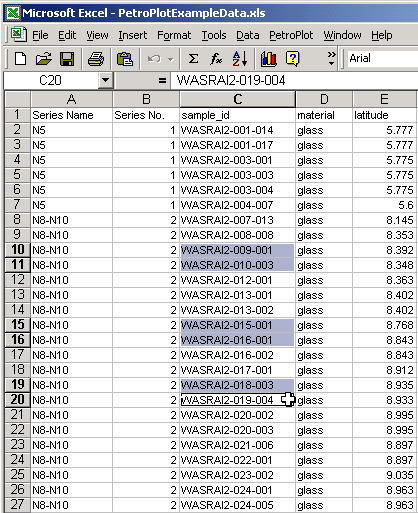
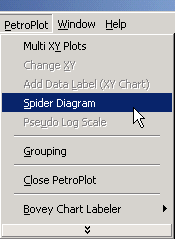
Click PetroPlot --> Spider Diagram.
Purpose:
Spider diagrams, which present data for many elements normalized to reference such
as primitive mantle, are common plots used to compare samples and to investigate
trace element systematics. In order to make a spider diagram,
the data have to be organized such that elements are in a specific order,
and chemical values are divided by the standard values.
PetroPlot “SpiderDiagram” function automates the entire process.
Start:
Make sure the file PetroPlotSpider.xls is open.
You can customize the standard values in the "PetroPlotSpider.xls" file.
Step 1:
Select a set of rows on a data sheet.
(Notice: You can select any column. PetroPlot only reads the row positions from your selection.)

Click PetroPlot --> Spider Diagram.

Step 2:
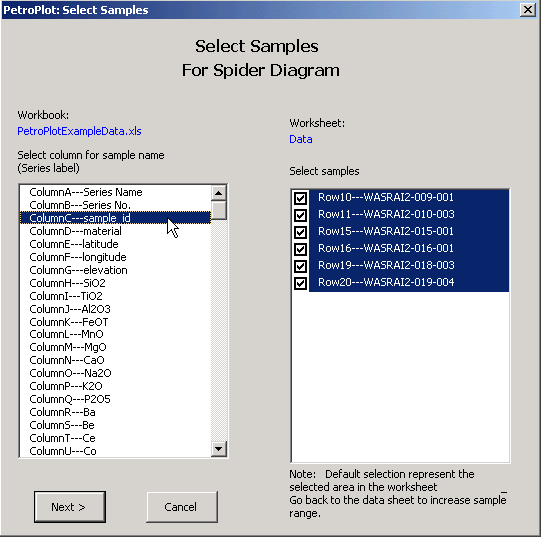
Select a column as legend for the spider diagram, then click "Next"
(Warning: Don't use any number values as legend,
e.g. if a sample is named as "32", rename it to a string.)
Step 3:
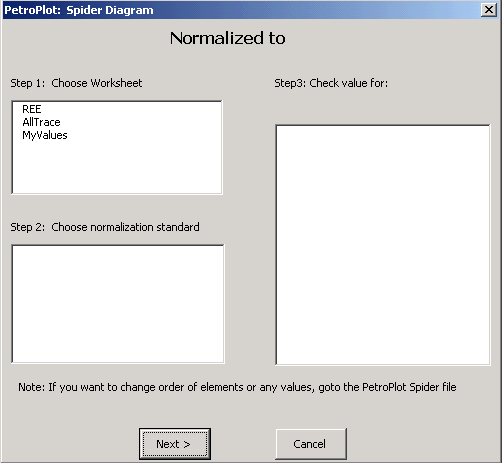
Set up standard values (i.e. to what values data should be normalized).
Select a worksheet:
When you click a value in the upper left panel, the lower left panel will show standards in the selected worksheet
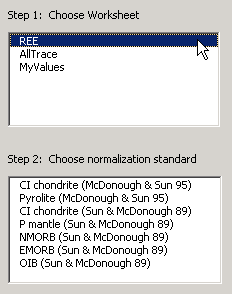
Select a standard:
When you click a standard in the lower left panel, the right panel will show values.
However, you don't need to select from the right panel.
The right panel is for the purpose to check values and make sure those are what you want to use.
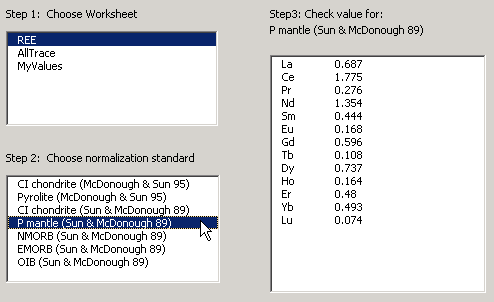
Click the "Next" button. Done!
Results:
PetroPlot adds a new sheet for selected samples, orders the elements based on the selected standard,
calculates the normalization values, and makes line charts.
Known problems:
Use numbers as legend.
If you use numbers as legends, the PetroPlot program will generate errors.
Details...
Last modified 05/10/2002, Yong Jun Su
This line marks the end of PetroPlot Tutorial: Spider Diagram function