Select a range of cells equal in length to your x and y arrays.

Purpose:
These functions (Spline and Splint) implement the cubic spline algorithm for interpolating to any x-value given a series
of (x,y) pairs. The interpolating function is made up of a sequence of cubic polynomial curves that meet at the given
data points with continuous first and second derivatives. Significantly better than linear interpolation for relatively
smooth data. See Press et al., Numerical Recipes 2nd Edition, pages113-116.
Start:
Select a range of cells equal in length to your x and y arrays.

Step 1:
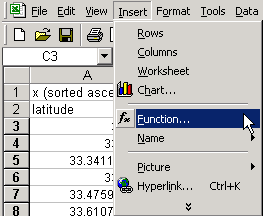
Choose Insert->Function.
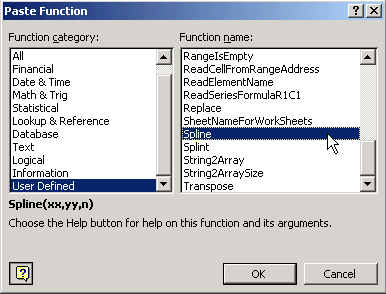
Choose ->User defined->Spline.
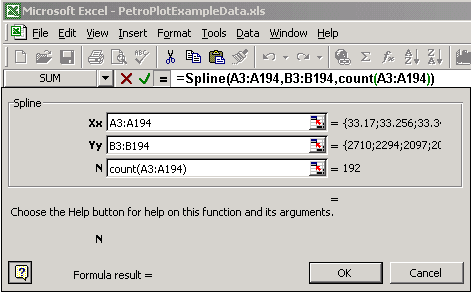
Enter the range of x values, the range of y values, and the number of data pairs.
To fill the whole selection: Type Command+Return(Mac) or Ctrl+Shift+Enter(PC)
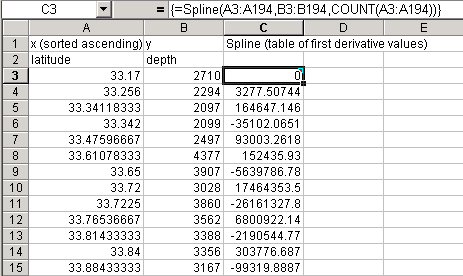
This is a table of the numerical estimates of the second derivative of
your function at each data point. You only have to do this once to generate the interpolating function, you can now use
it multiple times for various values of x.
Step 2:
Now, to interpolate to any x value.
Select a range of cells equal in length to your x.
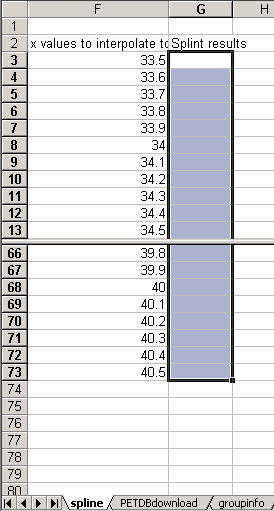
Choose Insert->Function->User defined->Splint.
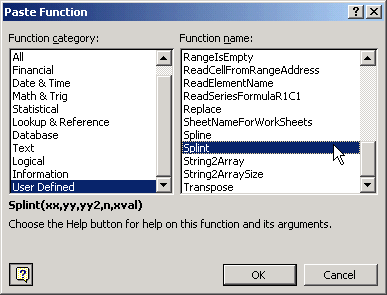
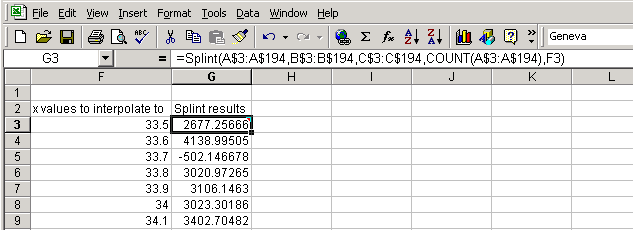
Enter the ranges of x values, of y values, of
output from Spline, the number of data pairs,
and the x value at which to evaluate the interpolating function.

To fill the whole selection: Type Command+Return(Mac) or Ctrl+Shift+Enter(PC)
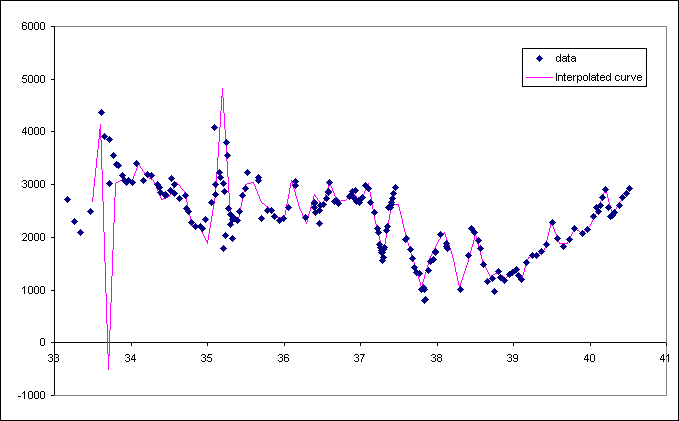
Result plotted.
Problems:
(1) The x-values must all be distinct, or the Spline routine will encounter a division by zero and fail.
(2) The data points must be sorted so that the x-values are either monotonically ascending or descending; otherwise the
Splint function will fail to find the right pair of points that bracket the desired x-value.
(3) If the data are very noisy, the interpolating function can have wild swings to nonsensical values.